Vehicle ECU development: Hardware debugging for functional safety
Tests regarding functional safety play an important role in the development of vehicle ECUs. Tests at various stages help the developer to ensure conformity with ASIL standards. What role does hardware debugging play here? An overview.
By Armin Stingl
An increasing number of electronic control units (ECUs) are distributed in modern vehicles. These embedded systems provide various functions, from basic driving functions and safety measures to comfort and entertainment functions. Faults in the ECUs can have different impacts on passenger safety depending on the function. For this reason, ECUs are classified according to the various Automotive Safety Integrity Levels (ASIL).
For example: The ECU for electric steering obviously has a strong influence on safety, as a malfunction of the steering can lead to serious injuries or even death of a passenger. Therefore, this ECU is classified as ASIL-D, the highest level of safety requirements.
When developing an ECU with such an ASIL classification, it is necessary to consider safety from the very beginning. According to ASIL-D, the development process must meet the requirements specified in the ISO26262 standard. Therefore, the entire software design should follow an appropriate development methodology. The tools used may need to be qualified to prove that they are suitable for this purpose.
The ECU is then tested together with the corresponding software on several stages using various methods. These include unit testing, system integration tests and hardware-in-the- loop tests. Many of these tests can be supported using a hardware debugger to test as close as possible to the real hardware – as recommended by ISO26262.
Various requirements in one ECU
Today's high-performance ECUs typically implement not just one type of application, but several. These can have different levels of functional safety. For example, in addition to an ASIL-D application, an ECU can also implement a QM-level application (quality management, i.e., without special functional safety requirements). What does this mean for software development?
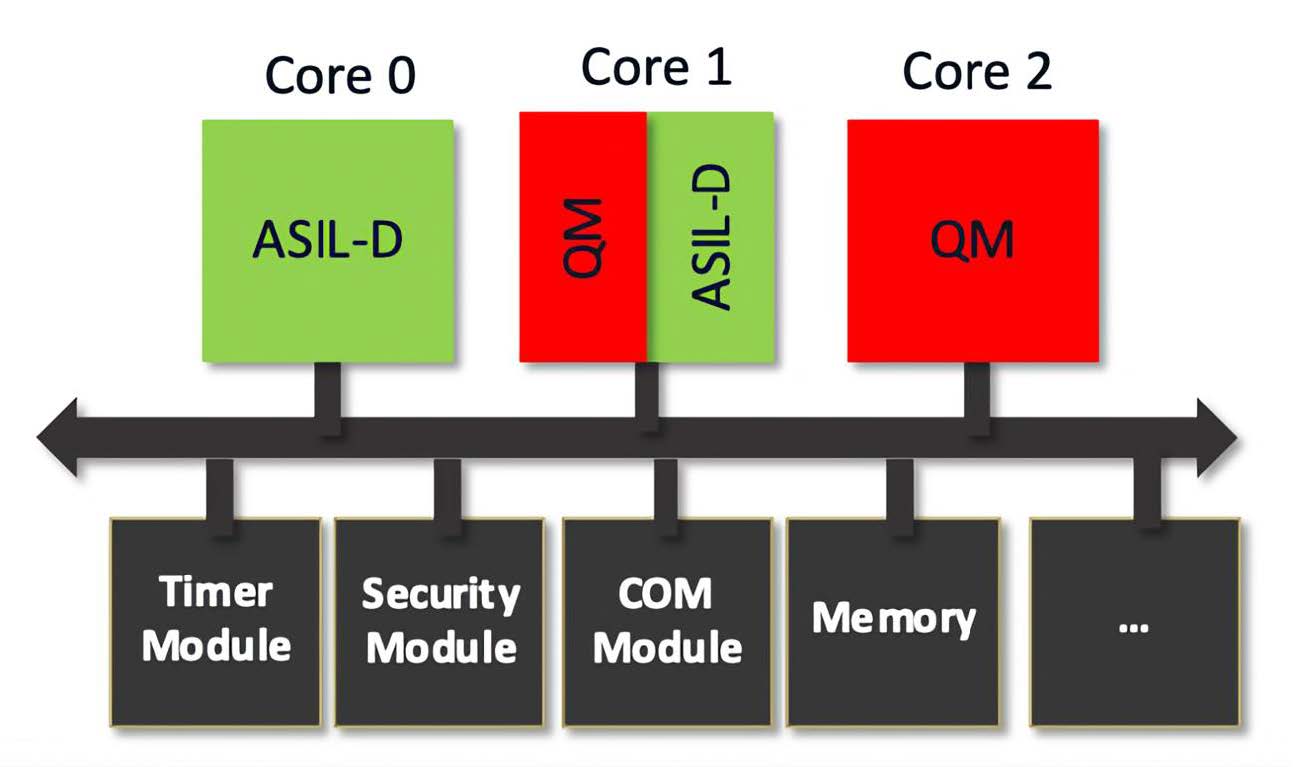
In this case, there are two ways to meet the requirements of the ISO26262 standard: Either all components are treated as if they had to meet the highest ASIL requirements, or Freedom from Interference (FFI) must be guaranteed. This means that it must be ensured that the QM part cannot interfere with the ASIL part in the same ECU (Figure 1).
On the one hand, FFI must be guaranteed regarding memory utilization. The QM part must therefore not be able to corrupt the memory allocated to an ASIL part. The second aspect is Timing & Execution. Here, for example, it must be ensured that the execution of QM software cannot block the execution of ASIL software. The third aspect, Information Exchange, refers to the disruption of a data communication between a sender and a receiver, e.g., by inserting invalid data or blocking a communication path.
Analysis of source code
For the successful development of safety-critical applications of an ECU, the compiler must be qualified accordingly. It is helpful if the compiler is certified, such as the compiler tool sets from TASKING.
However, even for a qualified compiler – as for all tools used – a risk assessment must be carried out in accordance with ISO26262. Every compiler has bugs, too. All known ones are listed in the so-called errata sheet. For safety-critical applications, the source code must be analyzed and checked to see whether it could be affected by known compiler bugs.
Mostly this is done manually. However, there are tools, such as TASKING's TriCore Inspector, which automatically inspects source code for all known compiler problems and generates a corresponding report. This report can then either be used to adjust the source code or simply attached to the risk assessment report.
After the compiler, the code itself must now be checked for errors, among other things regarding the FFI requirements. Tools such as the Safety Checker from TASKING help here, comparable to a static code analysis that is completely compiler-independent. The developer specifies to the tool the intended access rights of all safety and QM partitions in the system, i.e., read/write and execute rights for specific memory areas. Then the tool examines the entire source code and tries to identify potential leaks, i.e., possible interference between partitions, e.g., due to unsafe, insufficiently secured use of pointers, global variables, or shared memories.
The assumption here is that separation between partitions is not achieved by hardware methods, i.e., methods such as a memory protection unit (MPU) or a hypervisor. Either such methods are not planned or available, or they are not yet enabled. In the latter case, the tool helps troubleshoot or prepare the software for an MPU. Instead of debugging one MPU exception after another once the MPU is enabled, the software can be prepared in advance. And that without running the software on any real hardware.
Unit testing on the target hardware
The next test step in ECU development is the unit test. In most cases, unit tests are performed at source code level and on a host PC. This means that the source code to be tested is packaged in a test framework. Stubs (additional code that replaces another code component during the test run. e.g., to simulate a component that has not yet been implemented or hardware-dependent components such as IOs) can then be added here. Together with the test cases, the entire package is compiled and executed on the host computer, such as a Windows or Linux PC. The result is a test report that essentially gives a pass/fail for all test cases, usually along with a code coverage report. Since the execution is done on the PC, the basic execution on the real hardware is not covered. The tests may not produce identical results.
That's why ISO26262 recommends: “The test environment for software unit testing shall correspond as closely as possible to the target environment.” So why not run the test directly on the target?
Hardware debugging tools are traditionally used for development and debugging of drivers, board/hardware bring-up, boot processes and much more. In other words, for the “minimally invasive”, hardware-oriented development of embedded software. In addition to these standard methods, hardware debuggers today also offer methods for controlling software tests on the target system. Here, the debugger connects to the actual target hardware via standard debug interfaces, with the purpose of developing and testing embedded software as close as possible to the actual hardware. This helps specifically in terms of safety requirements, i.e., FFI, execution and timing, and information sharing. Let's look at some specific test use cases.
When setting up for unit testing, the source code of the software under test is cross- compiled for the target device and not instrumented. This means that the original production code is tested on the target device.
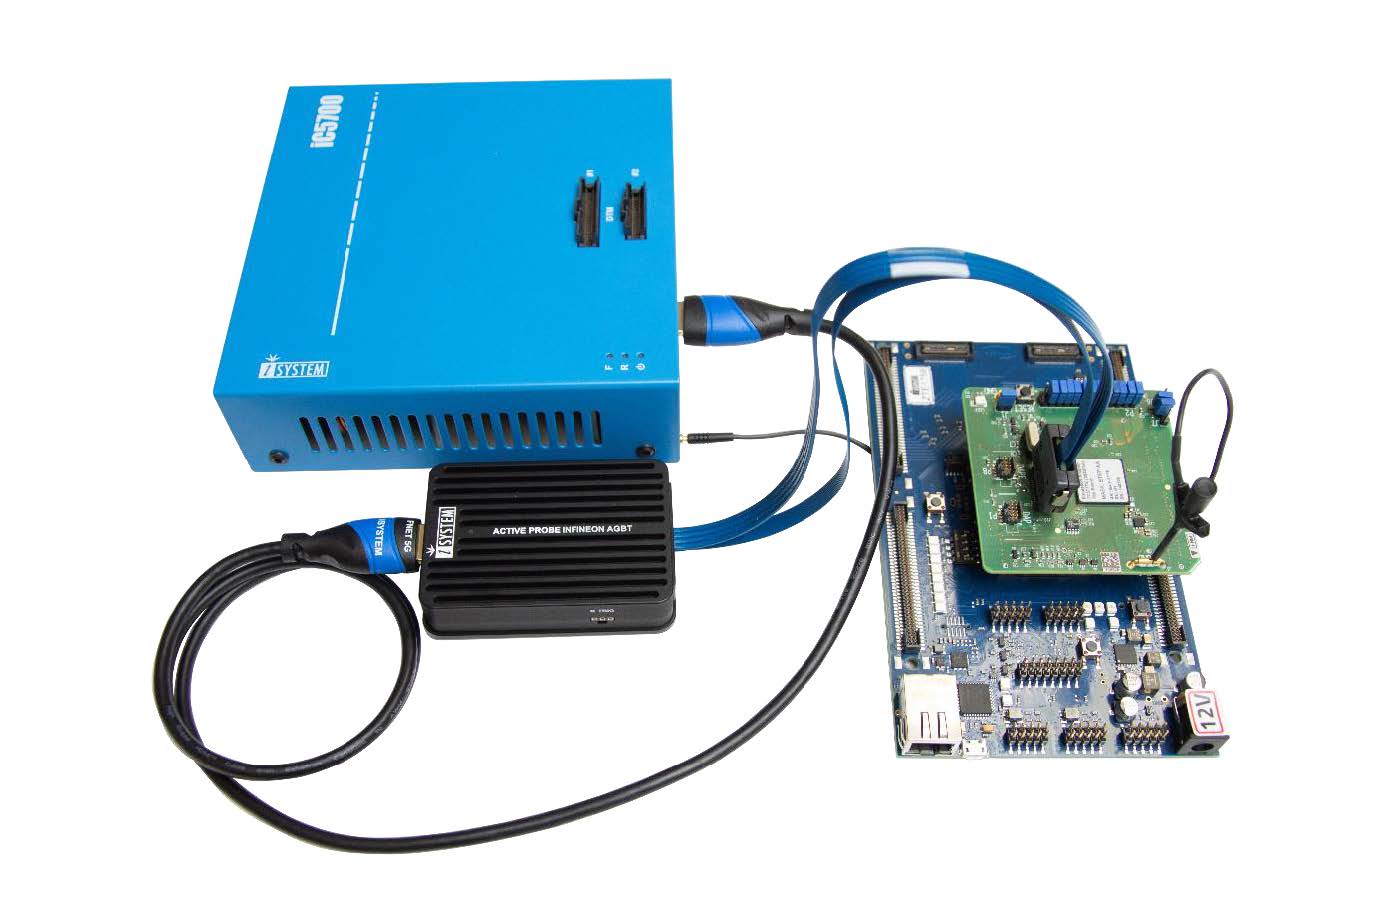
The actual control of the target to execute the test, i.e., downloading the code, calling the unit, i.e., the C function under test, setting the test input vectors and reading back the test results is done by the underlying debugger, such as winIDEA with BlueBox from TASKING (Figure 2).
As with execution on a host PC, similar test results are generated here: Pass/Fail results for each test case and a Code Coverage Report. However, here code coverage is measured based on a hardware trace record and as mentioned earlier, without any source code instrumentation.
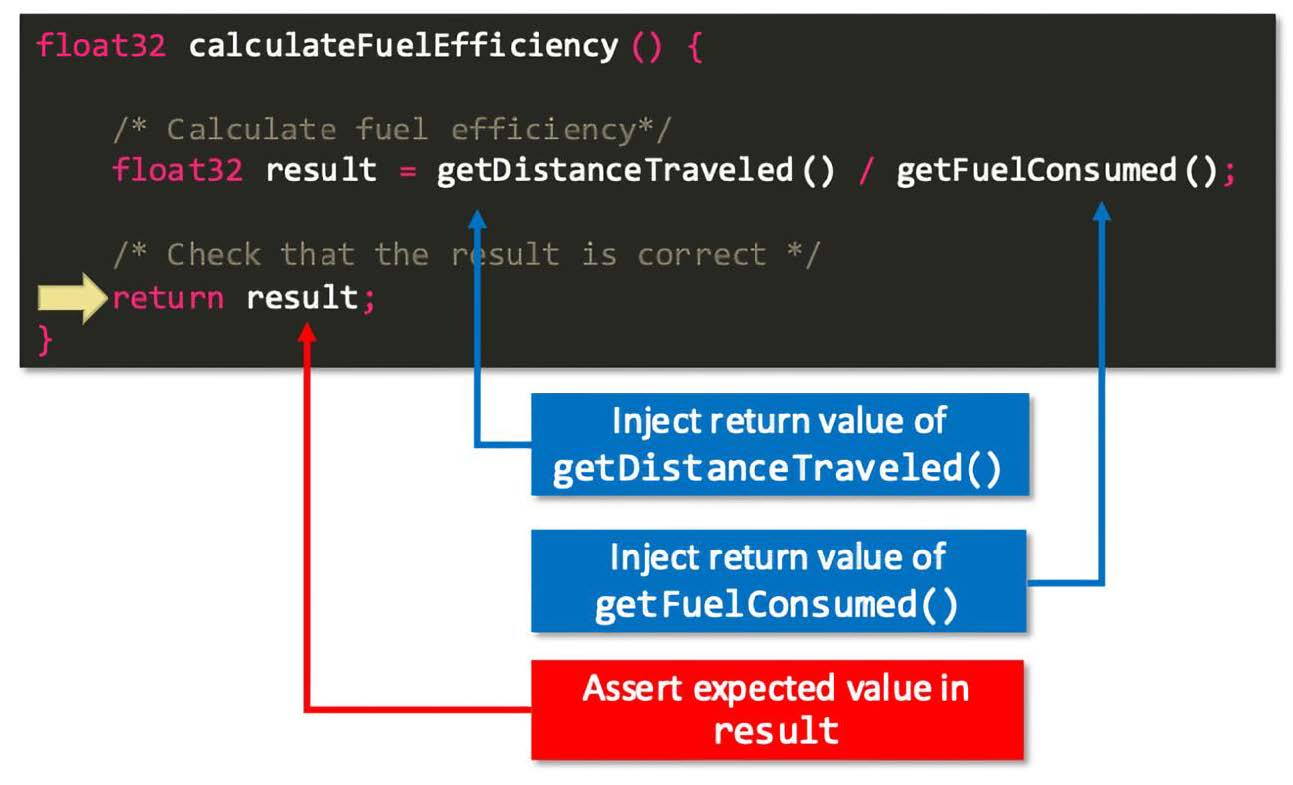
For a deeper understanding of how a unit test is executed on a real target without code instrumentation, let's consider the unit test for the C function "calculateFuelEfficiency" as a specific example (Figure 3). When using a debugger, the entire application does not have to be executed until the function call. The debugger can set the instruction pointer of the CPU directly to the function entry. Following C calling conventions, the debugger sets up the stack frame for the function and then starts the CPU. The debugger stops the CPU when stubbing or data injection is required, for example, when subfunctions are called. Instead of calling these subfunctions, the CPU skips both functions and instead injects the desired return value directly into the designated CPU register. The CPU executes until the function returns, and here the debugger reads the result value, which can be checked against some pass/fail criteria. All this works with unchanged production code.
Fault injection
After unit testing, we move on to system-level testing, for example within a hardware-in-the- loop configuration. In this case, a debugger can be very useful to inject faults into the system to test the impact on the FFI in terms of memory corruption, execution, and information sharing. The debugger is used to perform on-the-fly manipulations on on-chip resources such as CPU core registers and memory and then examine the effects (Figure 4). But faults can also be injected at external interfaces: Add-on modules for CAN/LIN and analog/digital signals connected directly to the debugger hardware and target system can be used to inject faulty data into an ADC or from external sensors connected via CAN or SPI.
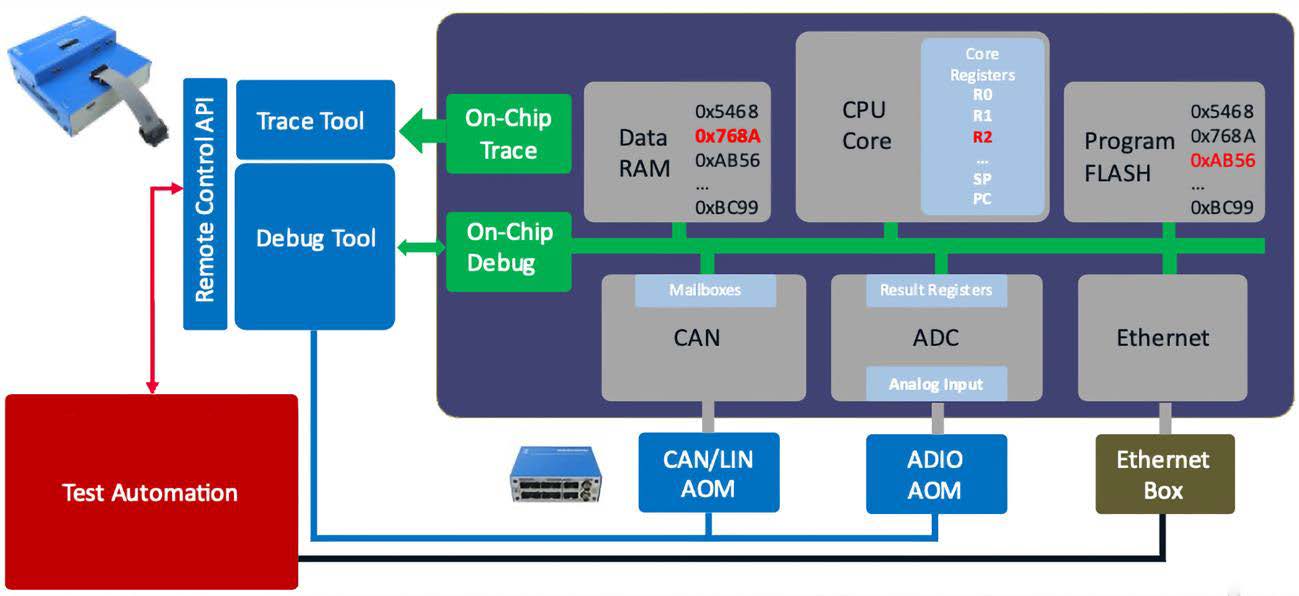
For example, it is checked whether a malfunction of a QM software can have an impact on the execution of an ASIL functionality. How the system reacts to such manipulations is observed, for example, with on-chip traces, the recording of processes in the software in real time via logging of execution times in the range of clock cycles. The hardware debugger connection between the PC and real target hardware is essential here. This means that a corresponding on-chip debug trace interface on the processor installed in the ECU must be available and led out.
Timing analysis
But on-chip traces not only enable the behavior of the software to be monitored. Since hardware traces are non-intrusive, i.e., have no influence on the runtime, they are also ideal for timing analysis. Timing tests should be performed as part of system integration testing. The increasing load on the operating system tasks naturally affects the entire timing schedule, and later critical timing requirements can no longer be met.
In timing analyses regarding safety and FFI, it is also useful to look at the timing margins: Basically, the robustness of the entire software timing can be checked.
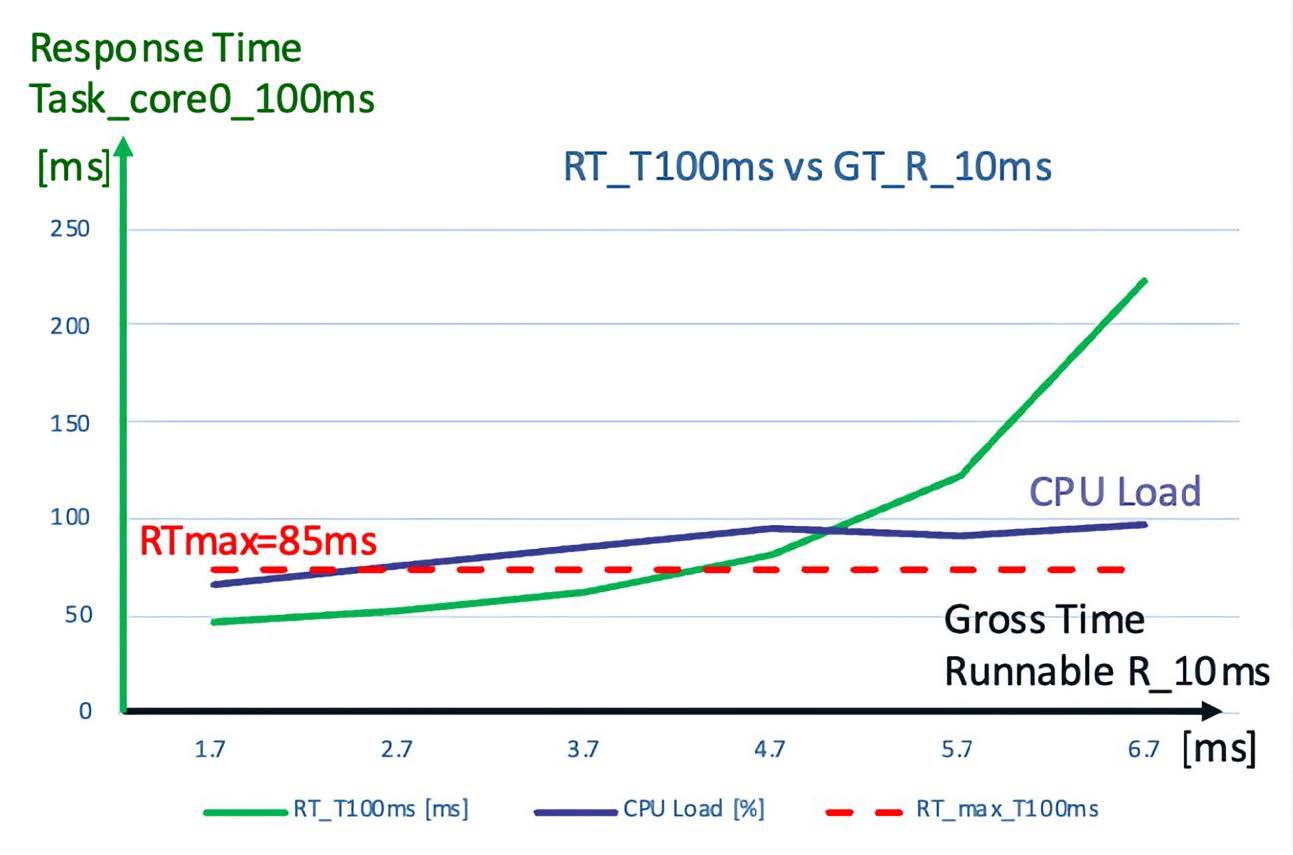
A use case shows what a combined debug and trace tool can do: Three tasks are running on a CPU, a 100ms, 50ms and a 10ms task. The 10ms task has the highest priority. More and more functions are added to the runnable of the 10ms task, and the effect on the response time of the 100ms task is measured.
Such a test can be implemented effortlessly by adding instrumentation code to the runnable to extend the runtime. A debugger can change this instrumentation code during the test run. Thus, the runtime of the runnable can be varied without having to rebuild the software.
An example result is shown in Figure 5. The green curve shows the response time of the 100ms task versus the runtime of the 10ms runnable. Assume that the 100ms task has a time constraint that the response time must not exceed 85ms: this time constraint can be achieved if the runtime of the 10ms runnable remains below 4.5ms. It is also interesting to note that at a certain point, the response time increases almost exponentially, and at this point the CPU load also stops increasing. This is a clear indication that the OS scheduling does not really work reliably anymore since the system is already overloaded.
Conclusion
The hardware debugger is increasingly a process tool – the basic functions of a debugger find their usual application and are supplemented with powerful analysis functions.
All the use cases and tools presented can be combined into a Continuous Integration pipeline that is explicitly focused on software safety testing. Thus, a test flow can be created, from static code analysis to unit tests on the target system to debug and trace (timing) tests.
Of course, it does not make sense to run all these tests on every commit. For example, a strategy would be to run code-level tests only at night or only on software releases, and integration tests every time software branches are merged into the master trunk.
Literature
Markt & Technik Trend Guide “Industriecomputer & Embedded Systeme", April 2022, print: https://wfm-publish.blaetterkatalog.de/frontend/mvc/catalog/by-name/MUT?catalogName=MUTSH2202D
Design & Elektronik 08-09/21, Oktober 2021, print: https://wfm-publish.blaetterkatalog.de/frontend/mvc/catalog/by-name/DUE?catalogName=DUE2108D