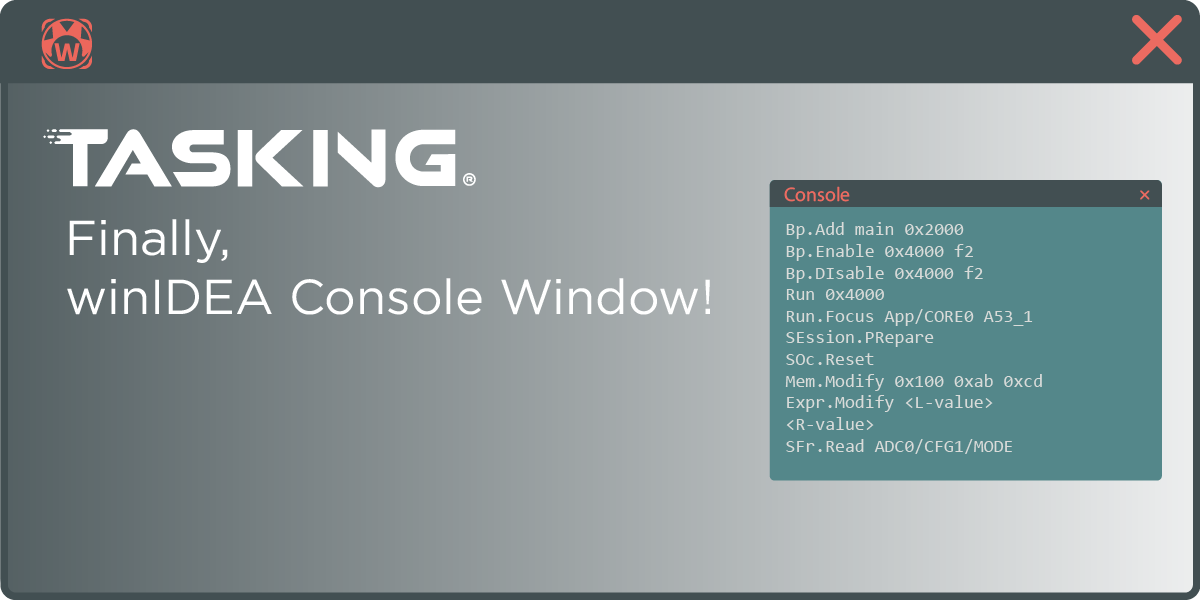
Finally, a winIDEA Console Window!
Debugging often involves navigating through various menus and dialogs in IDEs to perform actions. But now it has just become even more flexible. For those who prefer a keyboard-driven approach, we added the winIDEA Console Window, which provides access to your debugger commands entirely through keyboard.
The winIDEA GUI has long been known for its wide range of powerful features, giving developers fine-grained control over their debugging tasks. But sometimes, you just want to quickly set a breakpoint, step through code, or perform other common debugging tasks—without going through menus. The winIDEA Console Window addresses this with a simple command-line interface. It’s a great addition for those who prefer speed and simplicity in their workflow.
Enhancing, not replacing
The winIDEA Console Window doesn’t replace the flexibility and power of the winIDEA GUI; it simply offers an alternative for those who prefer working directly with commands. It complements the winIDEA’s rich menu system, giving you the freedom to choose the approach that suits your style.
Less clicking, more debugging
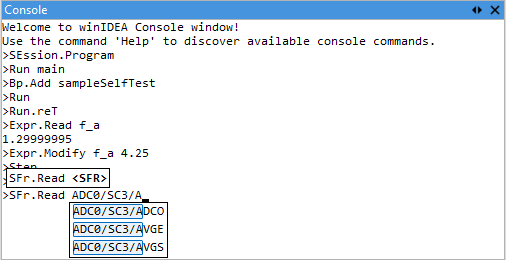
The winIDEA Console Window with its context-sensitive command-line autosuggestions tied to debugging constructs (SFRs, symbols, etc.) lets you quickly execute commands with just a few keystrokes.
Once the console window is open, you can immediately start using it. You can navigate through your command history and make use of autosuggestions. For example, typing Bp.Add main will set a breakpoint at the main function.
One Console Window to rule them all
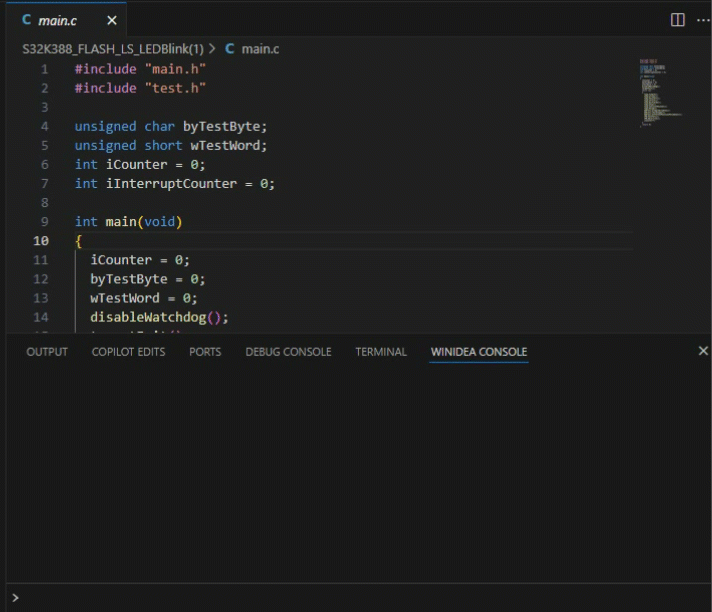
winIDEA or Visual Studio Code? The winIDEA Console Window has got you covered. It isn’t just available in winIDEA IDE— it’s also part of our Debug Extension for Visual Studio Code, bringing the same command-line debugging interface to another popular IDE. Whether you’re working in winIDEA or VSCode, you get the same workflow.
Ready to start?
To get started, download the latest winIDEA verified build, then create or open a winIDEA workspace in your chosen IDE, and follow these steps:
In winIDEA: Press the CTRL+SHIFT+C shortcut, and the console will appear.
In VSCode: Open the "winIDEA Console" tab in the bottom bar.
Once the console is open, you’re all set to begin. Detailed documentation and a full list of available commands are available here.
If you want to speed up your debugging process and take a more direct approach, the winIDEA Console Window is the tool for you. Give it a try today in winIDEA or VSCode, and discover how this new feature can make your debugging workflow even faster.