Enhancing Visual Studio Code Development with TASKING winIDEA Debug Extension
In recent years, Visual Studio Code (VS Code) has emerged as one of the most popular integrated development environments (IDEs). However, for developers working on embedded systems or requiring advanced debugging capabilities, the transition to VS Code may have posed some challenges.
Enter the TASKING winIDEA Debug Extension, a powerful tool that smoothly integrates the best features of winIDEA and BlueBox tools with the familiar VS Code environment, offering an unparalleled development experience.
The popularity of Visual Studio Code
VS Code has garnered immense popularity within the developer community for its lightweight yet powerful design, extensive customization options, and support for various programming languages and frameworks. Its intuitive interface, coupled with features like IntelliSense, Git integration, and a vast collection of extensions, has made it the go-to choice for developers across different domains.
Enhanced experience with the winIDEA Extension
The TASKING winIDEA Debug Extension serves as a bridge between VS Code and the robust debugging capabilities of winIDEA, offering a straightforward integration of the two environments.
Here's a closer look at what it brings to the table.
What is it?
The winIDEA Debug Extension is available via Visual Studio Code Extensions or on the Visual Studio Code Marketplace. It installs all necessary components effortlessly.
It provides Over-The-Air update capability, ensuring that you're always equipped with the latest features and enhancements.
The extension works with existing winIDEA workspace configurations, minimizing setup overhead. It fully supports the winIDEA SDK, enabling advanced automation and customization options.
Debugger Support
The extension offers support for TASKING BlueBox, as well as 3rd party hardware debuggers like Infineon miniWiggler.
Virtual ECUs such as Synopsys VDK, Synopsys Silver, and MachineWare are also supported, expanding the range of target platforms.
winIDEA VS Code Extension Debug Features
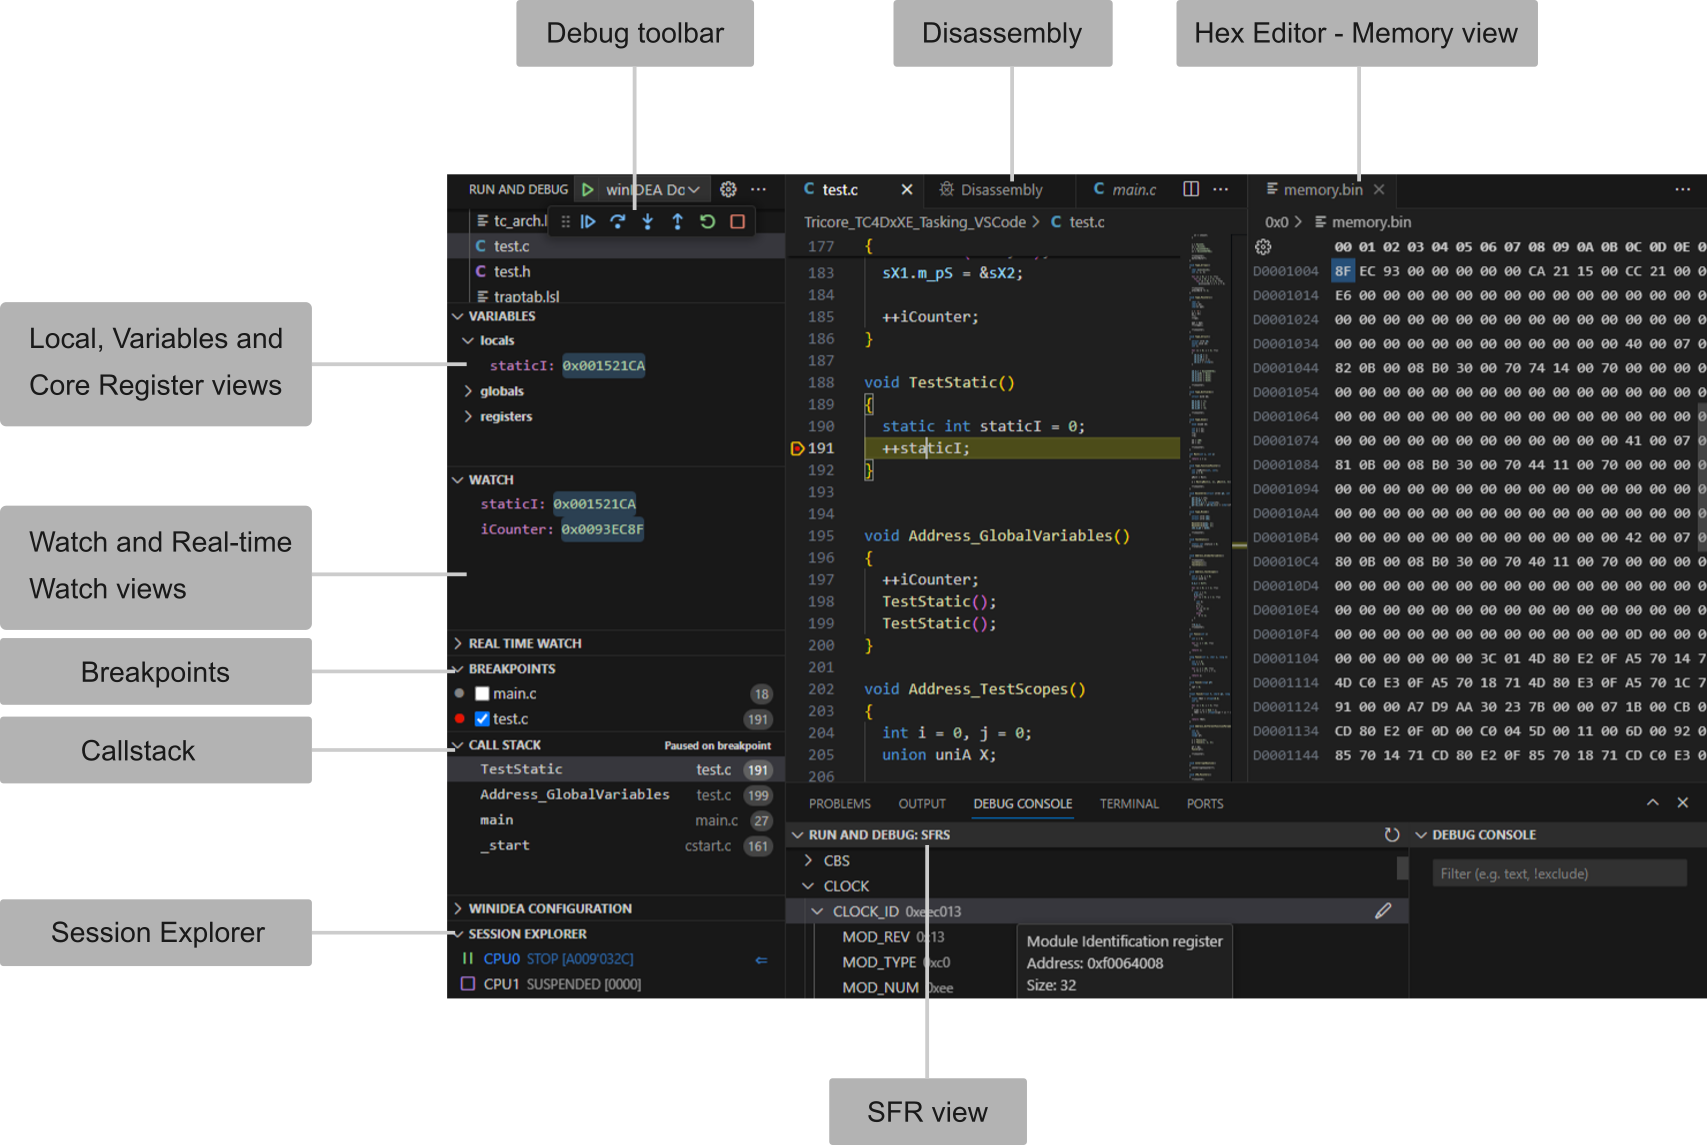
Standard debugging features including source-code and assembly-level debug, breakpoints, watches, and call-stack inspection enhance the debugging experience. Additional features such as Multi-Core Session view, Special Function Register view, and Memory view (optimized for professional use) provide deeper insights into the application behavior. The configuration of the debugger is made seamless with intuitive options accessible directly within VS Code.

Quick Setup
Getting started with the winIDEA Debug Extension is a breeze. Simply follow the "Get Started with TASKING winIDEA" Walkthrough provided by the extension. The walkthrough guides you through the installation process, setting up an example workspace, and initiating debugging quickly and efficiently.
Example Workspaces
You can select between many winIDEA Example Workspaces, among them e.g. Examples for TC399XE, TC4DxXE with iC7mini BlueBox Debugger - the new generation of BlueBox Debuggers.
Additional Enhancements - TASKING HEX Editor
For a more comprehensive debugging experience, the TASKING Hex Editor is installed together with the winIDEA Debug Extension. It is a fork of vscode.hexEditor extension with improvements tailored for debug memory viewing.
The TASKING Hex Editor implements the Debug Adapter Protocol and readMemory request, ensuring compatibility with the winIDEA extension and offering enhanced functionality.
Conclusion
The TASKING winIDEA Debug Extension enriches the Visual Studio Code development environment by simply integrating advanced debugging capabilities, previously available only in dedicated IDEs like winIDEA, with the familiar and versatile interface of VS Code. Whether you're debugging complex embedded systems or exploring the intricacies of low-level code, this extension empowers developers to achieve more, efficiently, and effectively, by harnessing the best of both worlds.

