winIDEA Debugging Features Accessible in NXP's S32 Design Studio
Developing complex embedded systems requires robust tools that optimize the coding, debugging, and testing processes.
winIDEA IDE is an Integrated Development Environment (IDE) widely recognized for its comprehensive debugging and testing capabilities. It supports a wide range of microcontrollers and processors, offering features such as real-time data acquisition, advanced breakpoints, and multi-core debugging.
NXP's S32 Design Studio (S32DS) is an Integrated Development Environment (IDE) tailored specifically for the development of automotive and industrial embedded systems. It is part of NXP's S32 Automotive Processing Platform, which provides tools for the design and development of complex automotive applications, such as advanced driver-assistance systems (ADAS), vehicle electrification, and other control applications.
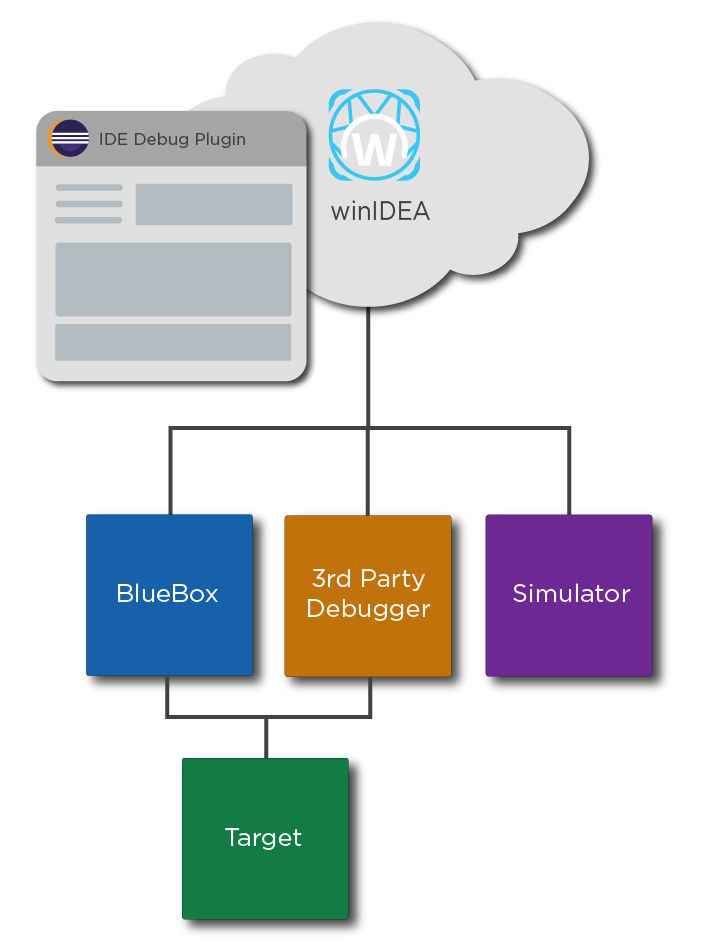
winIDEA functionalities are integrated into NXP's S32 Design Studio (S32DS). This integration allows you to access winIDEA debugging tools directly within the S32DS environment, providing a more cohesive and efficient development workflow tailored for NXP platforms.
Supported Debug Features
With this integration, you can get a robust set of winIDEA debugging features directly in S32DS, including:
-
Breakpoints: Set and manage breakpoints to control and observe your code's execution.
-
Watches: Monitor the values of variables in real-time to detect changes and debug issues.
-
Locals: Inspect local variables to better understand their state during execution.
-
Call Stack: Navigate through function calls and trace the flow of your application.
-
Memory: Directly access and modify memory for low-level debugging and validation.
-
SFRs (Special Function Registers): Monitor and manipulate hardware registers for precise control during debugging.
-
Disassembly: Jump into the assembly code for low-level debugging at the instruction level.
-
Session Explorer: Track and manage various debug sessions to maintain control over your development process.
-
Deep winIDEA Configuration: Customize your debugging setup with advanced configuration options tailored to your needs.
-
Multi-Core Debugging: Debug multi-core applications, ensuring synchronized operations across all cores.
Centralized Workspace and Increased Efficiency
NXP S32 Design Studio offers a unified environment with winIDEA where coding, compiling, and debugging are integrated. This centralization reduces the need to switch between different tools, enhancing productivity and simplifying your workflow. The user-friendly interface combines winIDEA debugging capabilities with the comprehensive development tools of S32DS, making your debugging process more intuitive and efficient.