Advanced Parallel Tracing with Active Probe Parallel
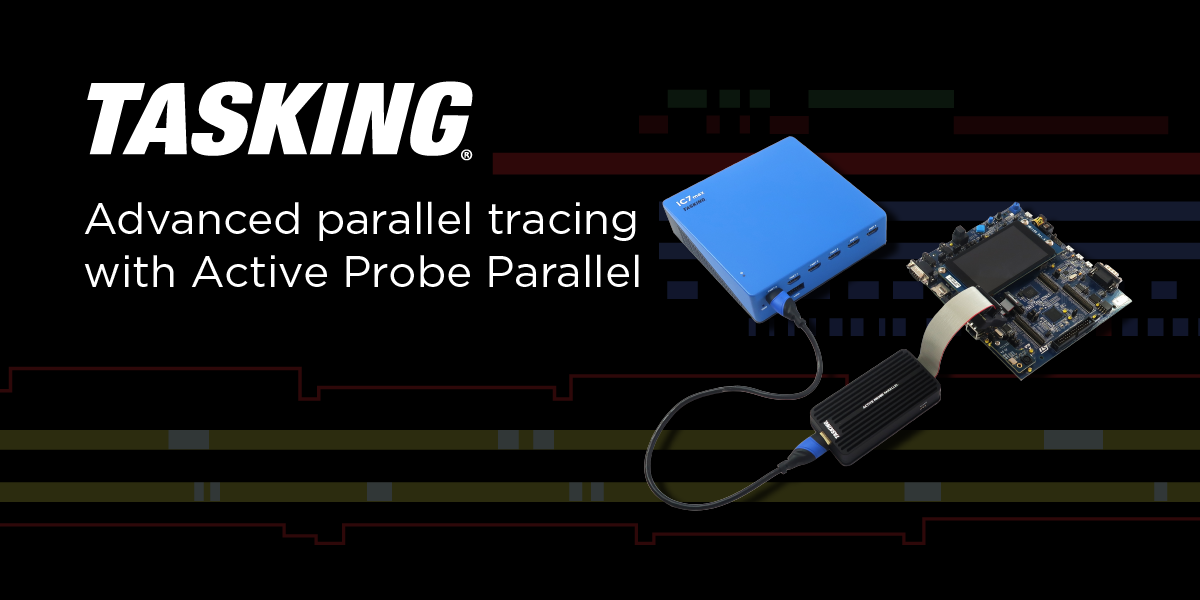
The new TASKING Active Probe Parallel offers a comprehensive solution for debugging a variety of microcontroller architectures. As the name suggests, Active Probe Parallel supports parallel tracing among all other Debugging and Tracing protocols.
One of the key advantages of parallel trace is that multiple bits of data are transmitted simultaneously across multiple wires, which:
- Allows higher data throughput without requiring a very high clock speed
- Result in lower latency compared to serial interfaces and can be an advantage in time-critical applications where even small delays are significant
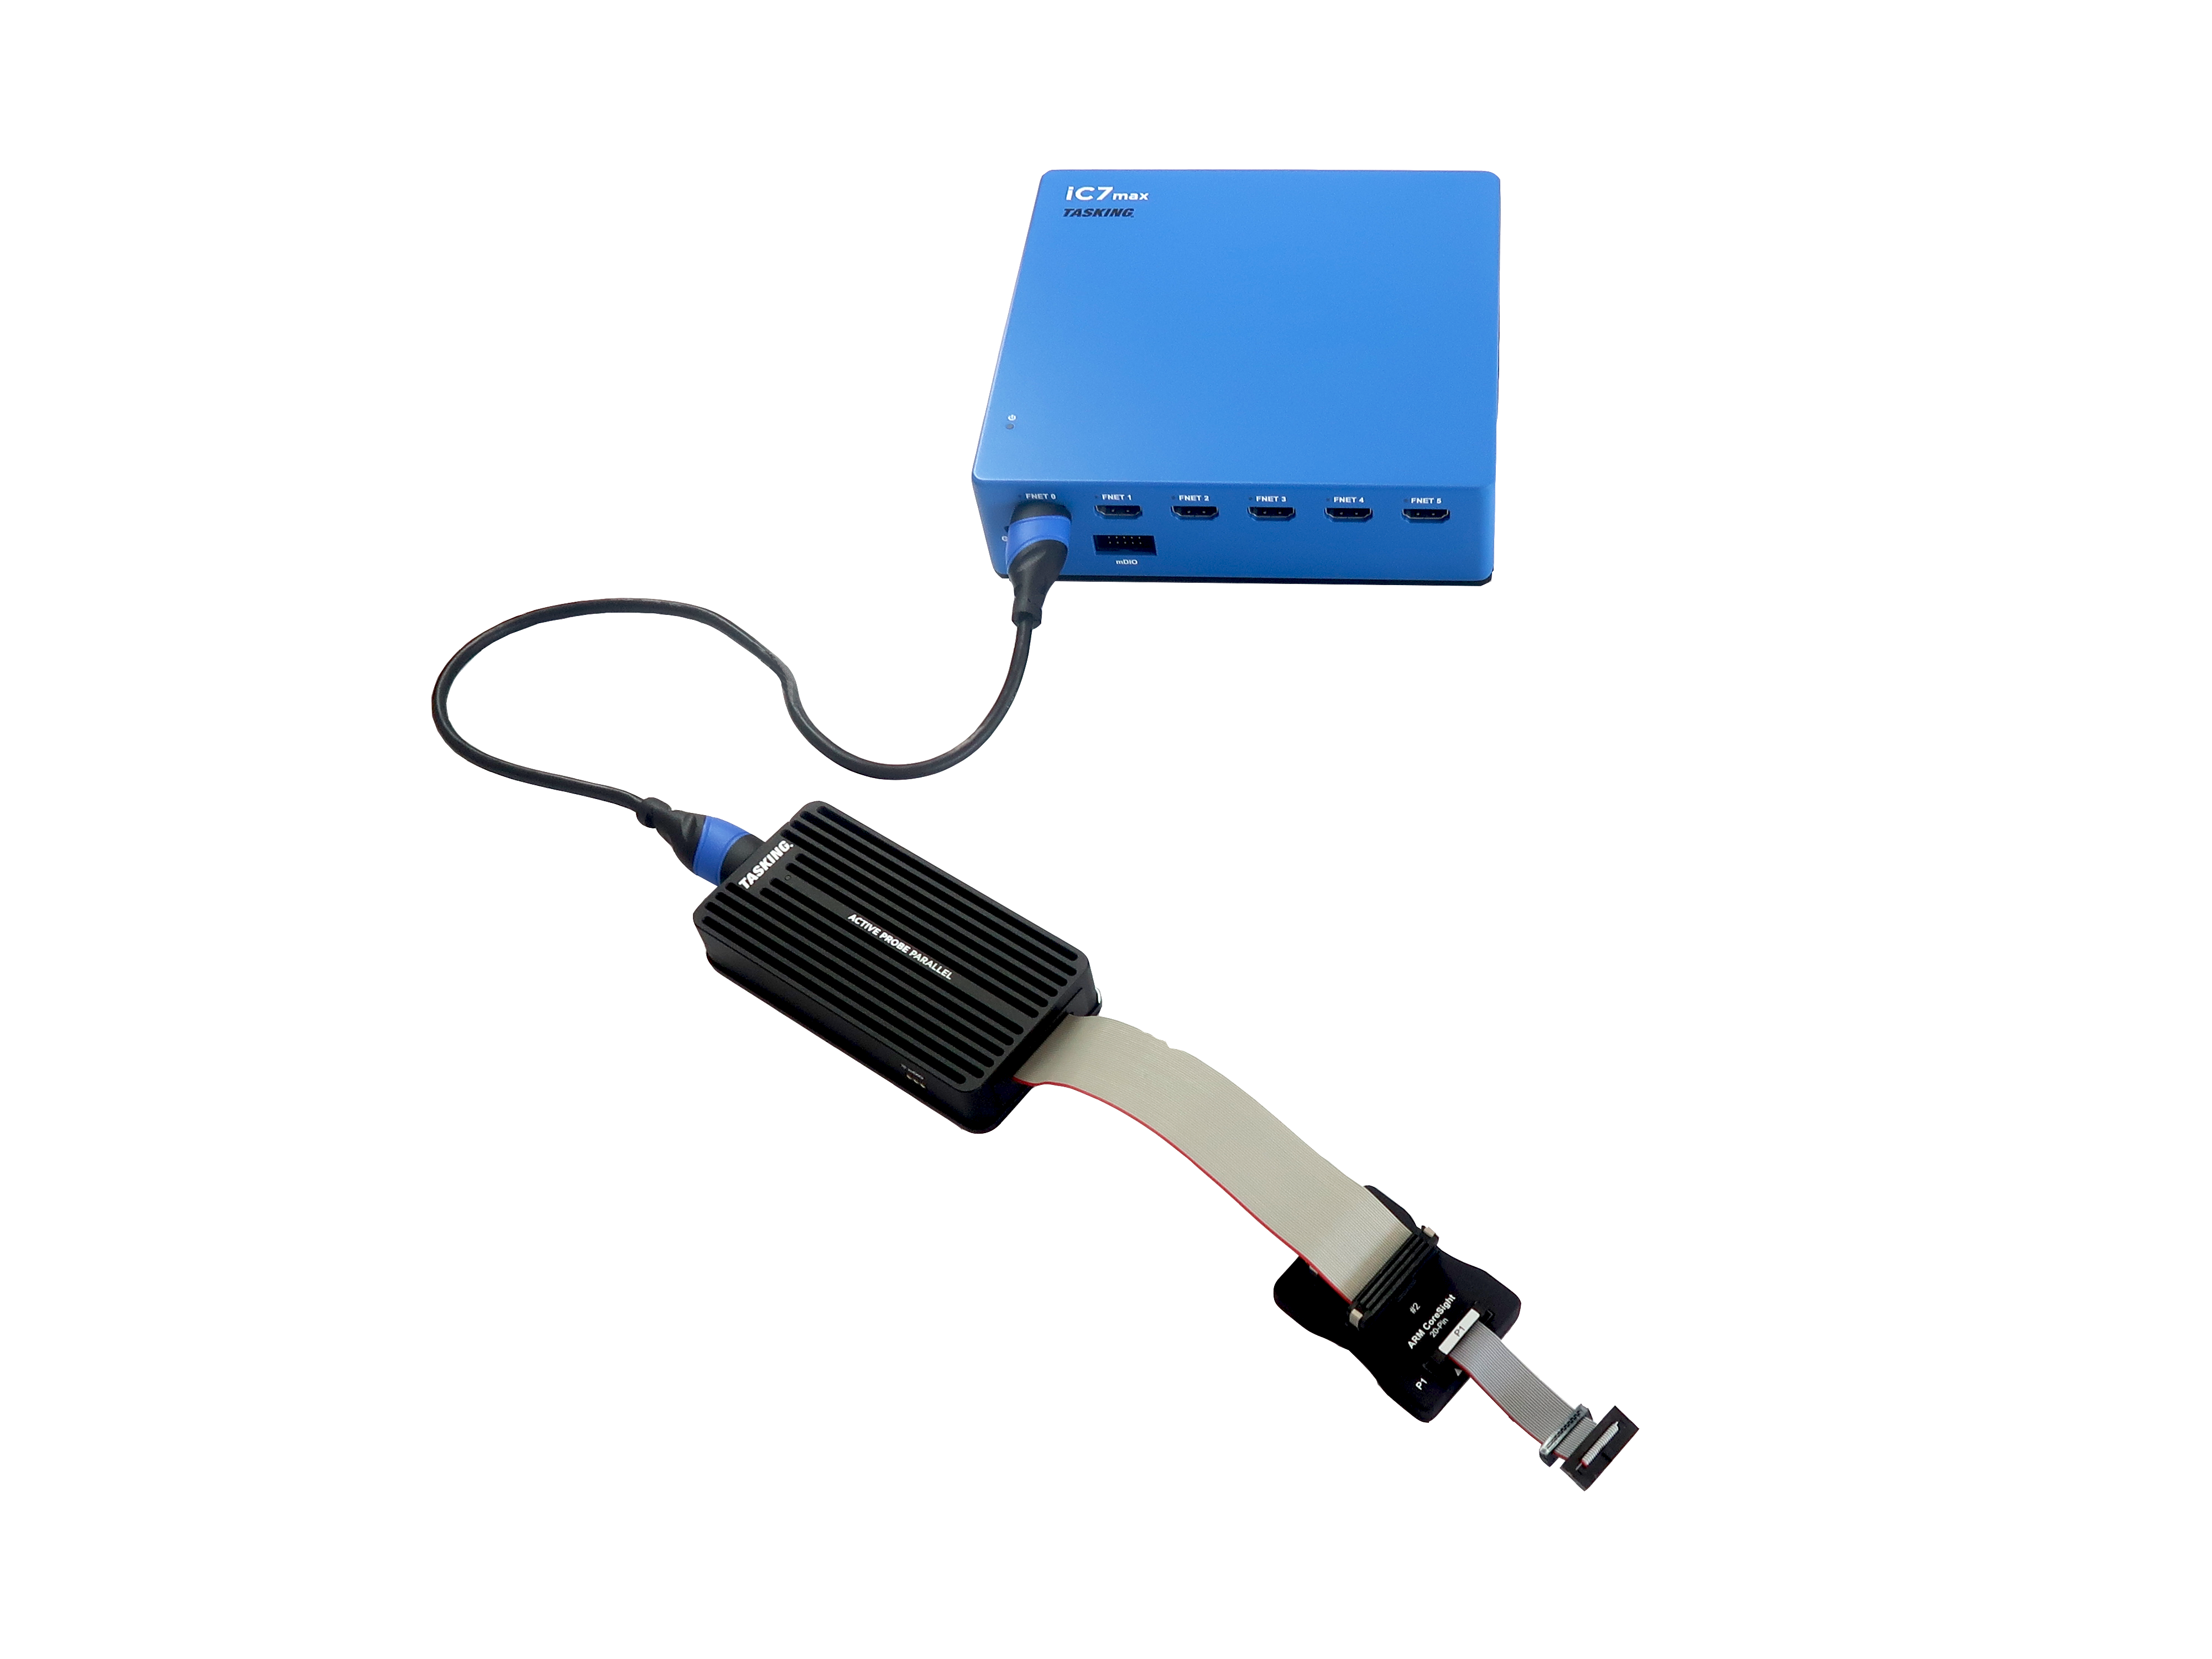
Key Components and Connectivity
The Active Probe Parallel connects to the iC7max BlueBox Hardware Debugger via an FNet cable. This setup ensures a high-speed and reliable connection for advanced debugging, analyzing, and testing.
Active Probe Parallel supports the following protocols:
- Debug Protocols:
- Joint Test Action Group (JTAG)
- Arm Serial Wire Debug (SWD)
- RH850 Low Pin-Count Debug (LPD)
- Trace Protocols:
- Software Trace
- Parallel Trace
- On-chip trace buffers
- Single Wire Output (SWO)
· Its compact design enables connections to various target microcontrollers in tight spaces, with a connection range extending up to 10 meters from the iC7max BlueBox Hardware Debugger.
To connect the Active Probe Parallel to different target microcontrollers, specific adapters are required. These include:
- Arm Mictor 38-Pin Adapter
- Arm CoreSight 20-pin Adapter
- MPC5xxx Nexus 38-pin Adapter
For non-standard pinouts, converters are available to ensure compatibility with the Active Probe Adapter.
Getting started with Active Probe Parallel
Starting with new software and tools can be challenging. TASKING provides a series of Getting started tutorials to help you get up to speed with the Debug, Test, and Analyze Tools.
These tutorials guide you through the entire process, from installation to starting your first debug session, ensuring a smooth transition into using Active Probe Parallel for your development needs, for example:
- Setup and Configure BlueBox Hardware
- Connect the BlueBox and the Target via Active Probe Parallel
- Getting started with Trace
More resources
- Active Probe Parallel - Hardware User Manual
- iC7max BlueBox Hardware Debugger - Landing page
- iC7max BlueBox Hardware Debugger - Hardware User Manual